Contents
Visualization
<img src=”/8holic/projectfiles/gachavisuals/visualization.png”
 alt="Visualization"

 class="blog-image">
Ideation
I heard people mention a few stats like certain character having the longest wait, so I was always kinda curious. I decide to take this own to use some of the things I learnt last semester.
getting the data point.
Since I already know there is a data point, I start off by checking robot.txt to make sure that they are ok with it. I noticed they block a lot of AI agents, and some spider. So I decide to use Selenium. The idea I had was that I would first get the URL, then I will run it through to grab certain information.
Most of the challanges are things I partially remember how to deal with, such as tabs and simillar things. I set my agent to have a 1 second delay on every agent just to ensure I do not DDOS the server by accident. Overall it went pretty ok, but these are the challanges.
-
Navigating the differnt character
This one was pretty ok, I realize very early on that the ID divison goes up by 2 instead of 1 for ID, so I ran two loops, the first loop will run the internal ID, the second loop oversee the entire thing to change character.
We get the url here.
-
Inconsistent format
Among the older ID, sometimes the date is just slightly enough that the XPath misses it, I think there is an extra divison somewhere because this is the difference. I end up doing a either/or for certain parameters, however this is not that significant and I corrected some of them manually.
For the major one like skills, I use a fuzzy form of searching instead, searching for Skill1 is enough compared to Skill1_0
-
All the weird characters
Something intresting, but excel cried pretty badly when processing korean/japanese/chinese characters. Installed the language pack to make this work out. I also wanted to get the element affilation even through I didn’t do anything about it, after looking around I decide that I can simply grab the name of the png, which is usually used to visually tell a reader.
But all in all, the data was relatively easy to get due to the relatively standalized format, it is not super clean like the perfect data my school gave me, but it is a little challanging to get. Most of the challange come from navigating the site.
Cleaning the data was intresting as well, however I will cover this more in the next part.
Visualizing the data
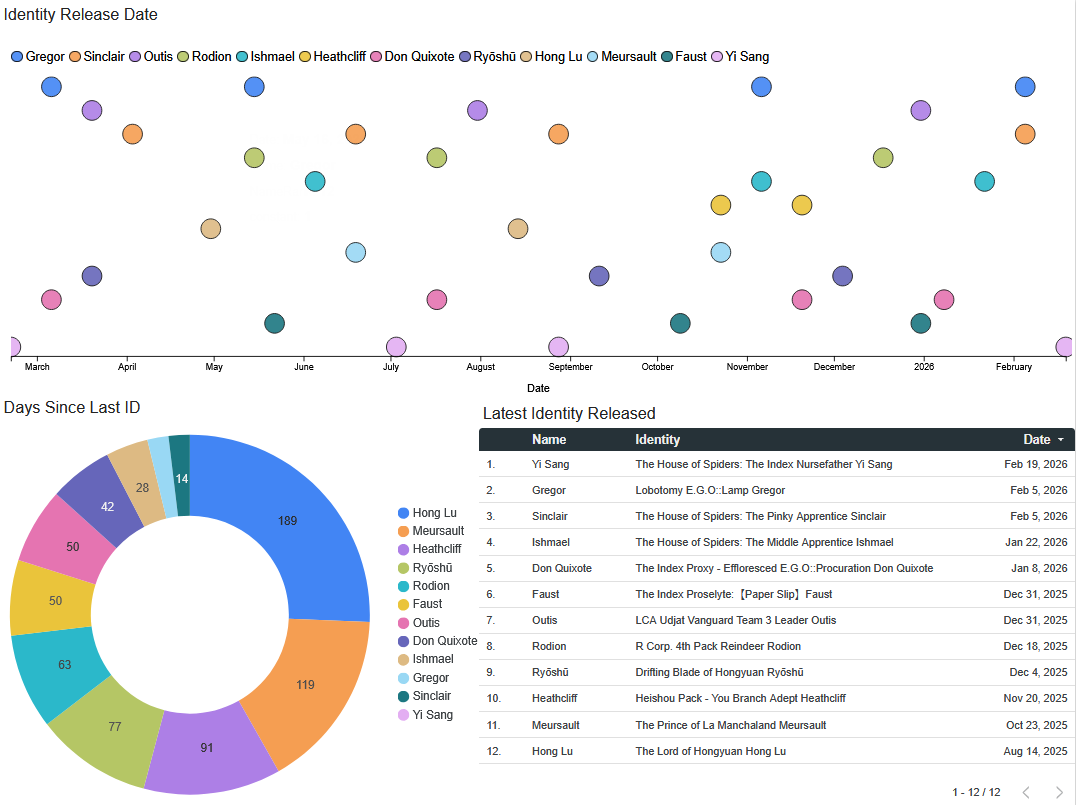
I learnt a bit about google data studio, so over here I decide to try my hand. Importing the data isn’t too difficult, however I soon realize that this is the hardest segment
Challanges faced
-
Getting the X axis to be a time series
Upon going in I already have a pretty good idea what I want the graph to look like, which is an issue when all the X axis generally support metrics only and not dates. Time series results in a line which isn’t exactly suited for these 1 off data.
Initally I thought to use the UEIX format for date in order to display as metrics, however due to the large value, it ends up really skewing the graph making it hard to read. In the end I just used a community visuzliaer instead. Thank you supermetrics
-
Making the data format correct
It become very clear that 19.02.2026 is being registered as a text, which is an issue, this wasn’t too bad as I used power query(or the google equivalent) to convert it into a date format. It took a while to get the formula right but it was pretty ok
-
Y axis must be a metrics
By far the largest issue I spend on, since I am using the names of the character, I basically have 12 strings while they only accept numbers. I looked around a bit, and eventurally decide I should convert the names into number so I can plot the graph. This leads to the final but most vexxing issue
-
The legends order is wrong
Since the previous segment is the Y axis, and the numbers don’t exactly mean anything, we will need someway to read the data. Initally I thought since our name has numbers, we will sort via numerical order, however the order seems to be random. Initally I thought it was alphabetical order, so I ran the parameter to add a number in front of the sinner names…and nothing changed. It isn’t numerical either since when I change the number everything jumped. I think it has something to do with the sort tab but I fiddle with it and nothing change. I have no idea what was causing this and was getting a little fustrated, so I decide perfection is the enemy of good.
So I just published it on reddit:
https://www.reddit.com/r/limbuscompany/comments/1r8y6iv/as_limbus_enter_its_third_year_i_tried/
As of writing I literally just publish it so I am unsure of the reception. However I believe I have reach a good end point.
Conclusion
Overall I learnt a bit about data visualization and how finnicky the software can be at competiting against what I wanted. I also learnt a bit about using creative walkarounds, through the final issue is still unresolved.
I also realize how scary it is to publish things I have done online even if fundamentally it doesn’t matter, I am unsure why? Maybe it is the fear of someone saying something mean about it, this would be an area of growth.