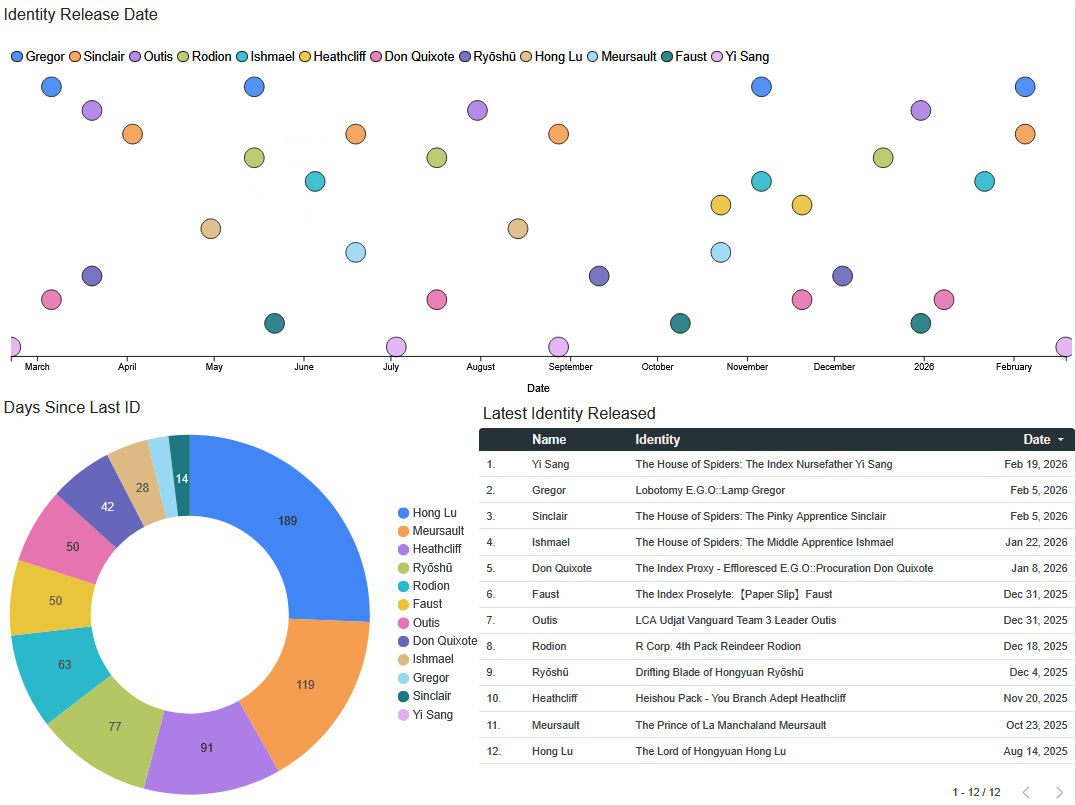
Visualization
<img src=”/8holic/projectfiles/gachavisuals/visualization.png”
 alt="Visualization"

 class="blog-image">
Inspiration
I kept hearing people mention stats like a certain character having the longest wait, and I got curious. I decided to look into it myself and put some of the things I learnt last semester to use.
What I did
I scraped data from the game’s site to build a visualization of every character’s stats.
- Checked
robots.txtfirst; since it blocks AI agents and some spiders, I used Selenium with a 1-second delay on every request to avoid accidentally DDOS-ing the server - Navigation challenges: character IDs increment by 2, so I ran two loops (inner loop for internal IDs, outer loop to switch characters); older IDs had inconsistent formats so I used
either/orXPath fallbacks and fuzzy searching for skills - Handled CJK characters — Excel choked on Korean/Japanese/Chinese, so I installed the language pack; grabbed element affiliations from image filenames
- Cleaned and visualized in Google Data Studio: fixed date-format parsing, worked around the X-axis only accepting metrics, converted character names to numbers for the Y-axis
- Published the result to the community on Reddit
What I’m proud of
- Working out creative workarounds for each obstacle (fuzzy matching, filename scraping, metric-based axes)
- Being deliberate about respecting the site — the polite request delay
- Actually publishing the work online, which I found intimidating
What can be further improved
- The legend ordering issue went unresolved — sorting was neither numerical nor alphabetical and I couldn’t pin down the cause
- Data collection relied on scraping; a cleaner API or more standardized source would have been more robust